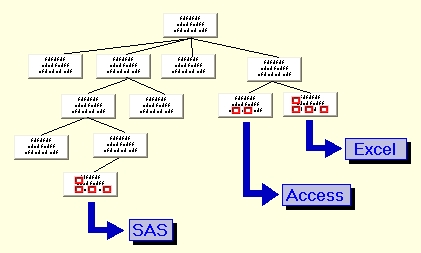

WinTree has been designed to provide great flexibility in what you can do with the output of a processed tree. Every node has an Action property that can be used to create output.
Move your mouse over each of the outputs on the right for more information.
If you have additional requirements, please discuss them with us and we can probably accomodate you.
Click Next to continue...

Output to Access...
The SAMPLE Action of a tree node can be used to extract data to MS-Access. The data is saved in a new table in either an existing or newly-created database.
Once the data is in Access you will be able to use Crystal Reports and other report writers.

Output to SAS...
The SAMPLE Action of a tree node can be used to extract data for viewing in a simple editor or for use by another program such as SAS or Excel. The following is an example of a SAMPLE Action. The result is a simple text file with the requested data.
SAMPLE
customer.customer_key,
' - ',
customer.name,
number_children,
prior_purchases
Output to Analysis...
WinTree supports the building of linear regression models. The results of the analysis can then be incorporated back into WinTree as a term to be used in subsequent runs. More about analysis...
![]()

More about analysis...
WinTree supports several methods of data analysis: Scatter Plots, Tabulations, Linear Regression, Logistic Regression, Linear Regression Model Selection and the tree itself which can be used for Segmentation Analysis. Also, data can be extracted and exported for use by other analysis tools.
The following is an example of using the Scatter Plot and the TAB action to determine if there is a correlation between variables. We will look at three variables, income (customer.income), affluence (customer.affluence) and number of orders (NumberOfOrders).
Output to Excel...
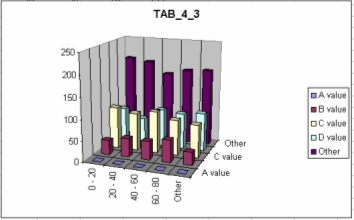
The TAB Action of a tree node produces counts of the number of occurrences of values of a RECODE expression. A RECODE is a way to classify continuous data for the purpose of creating useable interval counts. An example of a two dimensional cross TAB and its Excel chart is:
TAB
RECODE customer.income AS int
USING
TABLE (LOW -< 20000 := 1 'A value',
20000
-< 50000 := 2 'B value',
50000
-< 100000 :=3 'C value',
100000
-< 150000 :=3 'D value',
OTHER
:= 4 'Other'),
RECODE
metric_attributes.attr1 AS int
USING
TABLE (LOW -< 20 := 1 '0 - 20',
20
-< 40 := 2 '20 - 40',
40
-< 60 :=3 '40 - 60',
60
-< 80 :=4 '60 - 80',
OTHER
:= 5 'Other')